Introduction
Dash is a data visualization framework built from Flask and React. It is a powerful tool for building interactive dashboards that allow inputs from the user and can handle data streaming. Because it is built from Flask, it is also easy to embed analytics applications into other web applications developed with the Flask framework.
In this article, I will explore the basic functionalities of Dash that one should know to start making interactive analytic applications.
Initializing the application
The application is initialized in about the same way as a Flask application:
import dash

app = dash.Dash()

if __name__ == '__main__':
    app.run_server(debug=True)
Set debug to true when developing so you don't have to restart the server to see the changes you made.
The Dash application can be split in two parts: layout and interactivity. The layout part is where we set the organization of the page. The interactivity part consists of: - user interactions. - auto refresh (live data).
Layout
We need two libraries to setup the layout: - dash_html_components: Instead of writing HTML code to set the page layout, the dash_html_components library provides. - dash_core_components: describe higher level interactive components that require HTML, CSS and Javascript (eg. dropdowns, options, etc...).
Each component is described using keywords attributes.
HTML components
We create the page layout by nesting the html components the same way we would nest tags (<>) when writing HTML code.
The main attributes are:
- className: set the class(es) of the component.
- id: set the id of the component.
- style: inline styling of the component.
Example:
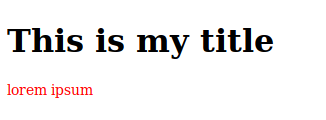
In this example, we are going to create a simple page. There is a main division that contains a headline and another division. The second division contains a paragraph. So, to build this page in HTML, we would use the <div>, <h1> and <p> tags. In Dash, we just have to use the Div(), H1() and P() components from the dash_html_components library.
import dash_html_components as html

app.layout = html.Div([
                html.H1('This is my title'),
                html.Div([
                    html.P('lorem ipsum',
                           id='my-paragraph',
                           className='my-class',
                           style={'color':'red', 'fontSize':14})
                ],
                id='another-div')
            ],
            className='container')
The above script will render the following HTML code:
<div class="container">
    <h1>This is my title</h1>
    <div id="another-div">
        <p id="my-paragraph" class="my-class" style="color: red; font-size: 14px;">
            lorem ipsum
        </p>
    </div>
</div>
Styling
Adding style in html component
We can add styling by passing a dictionary as the style argument to the html component:
app.layout = html.Div([
                html.Div('a div', style={'color': 'red', 'fontSize':14})
            ])
Output:
<div style="color: red; font-size: 14px;">
    a div
</div>
Adding style from a local .css file
We can save our .css files in an assets/ directory that we create in our project.
The css files in assets/ will be automatically included when we run our application.
project/
    |_ app.py
    |_assets/
        |_ styles.css
Any .js file and one favicon.ico file saved in the assets/ directory will also be included.
The files are included in alphanumerical order. It is recommended to prefix the files names with numbers to ensure their orders (e.g. 10_first_file.css, 20_second_file.css, ...).
Adding style from a remote .css file
If the assets are on internet, then we pass the assets_url_path argument to our dash application:
app = dash.Dash(__name__, assets_url_path='http://your-external-assets-folder-url/')
Adding external css
We can also include resources that are not hosted with our Dash application. To do so, we create a list of stylesheets. Each stylesheet is saved as a dictionary which keys are the attributes we would add to a <link> tag in HTML.
For example, to use Bootsrap from BootstrapCDN, we would add the following tag in HTML:
<link rel="stylesheet"
      href="https://stackpath.bootstrapcdn.com/bootstrap/4.3.1/css/bootstrap.min.css"
      integrity="sha384-ggOyR0iXCbMQv3Xipma34MD+dH/1fQ784/j6cY/iJTQUOhcWr7x9JvoRxT2MZw1T"
      crossorigin="anonymous">
We can see that the rel, href, integrity and crossorigin attributes were added to the tag.
In dash, we would declare the external_stylesheet as like this:
external_stylesheets = [
    {
        'rel':'stylesheet',
        'href':'https://stackpath.bootstrapcdn.com/bootstrap/4.3.1/css/bootstrap.min.css',
        'integrity':'sha384-ggOyR0iXCbMQv3Xipma34MD+dH/1fQ784/j6cY/iJTQUOhcWr7x9JvoRxT2MZw1T',
        'crossorigin':'anonymous'
    }
]
The stylesheets are then passed to the dash application:
app = dash.Dash(__name__, external_stylesheets=external_stylesheets)
Finally, we add bootstrap classes to our html elements. Here is a small example that shows how we can style our layout using Bootstrap:
import dash
import dash_html_components as html

external_stylesheets = [
    {
        'rel':'stylesheet',
        'href':'https://stackpath.bootstrapcdn.com/bootstrap/4.3.1/css/bootstrap.min.css',
        'integrity':'sha384-ggOyR0iXCbMQv3Xipma34MD+dH/1fQ784/j6cY/iJTQUOhcWr7x9JvoRxT2MZw1T',
        'crossorigin':'anonymous'
    }
]

app = dash.Dash(__name__, external_stylesheets=external_stylesheets)

app.layout = html.Div([
    html.Div([
        html.Div('1 of 3', className='col blue'),
        html.Div('2 of 3 (wider)', className='col-6 orange'),
        html.Div('3 of 3', className='col green')
    ], className='row')
], className='container')


if __name__ == "__main__":
    app.run_server(debug=True)

Core Components
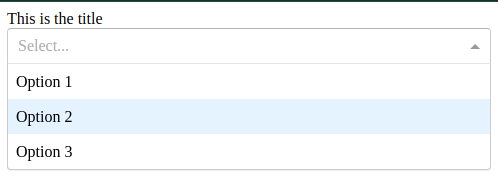
The dash_core_components (dcc) library provides the elements for interactive user interfaces.
Some common input components that can be found in the library are text input, dropdown, slide, checkbox, radio item, button, date picker, ...
The dcc components are added inside the application layout in the same way the HTML components are:
import dash
import dash_html_components as html
import dash_core_components as dcc

app = dash.Dash()

app.layout = html.Div([
    html.Div('This is the title'),
    dcc.Dropdown(
        options=[
            {'label': 'Option 1', 'value':1},
            {'label': 'Option 2', 'value':2},
            {'label': 'Option 3', 'value':3}
        ]
    )
])

if __name__ == '__main__':
    app.run_server(debug=True)
Graph
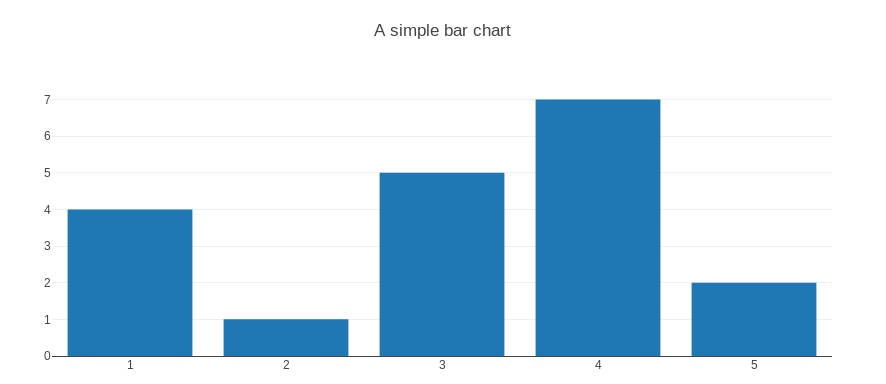
Graphs are set as a dcc.Graph component in the layout.
app.layout = html.Div([
    dcc.Graph(
        id='my-graph',
        figure={
            'data':[
                {'x':[1,2,3,4,5], 'y':[4,1,5,7,2],
                'type':'bar',
                'name':'my_data'}
            ],
            'layout':{'title':'A simple bar chart'}
        }
    )
])
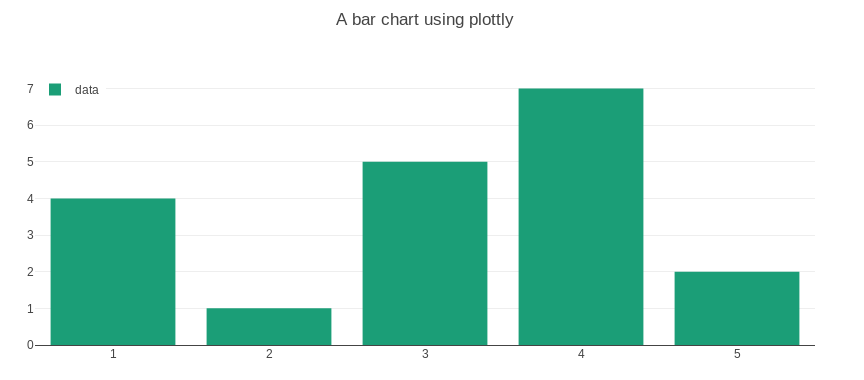
We can also use the same syntax as the plotly library:
import plotly.graph_objs as go


app.layout = html.Div([
    dcc.Graph(
        figure=go.Figure(
            data=[
                go.Bar(
                    x=[1, 2, 3, 4, 5],
                    y=[4, 1, 5, 7, 2],
                    name='data',
                    marker=go.bar.Marker(
                        color='#1b9e77'
                    )
                )
            ],
            layout=go.Layout(
                title='A bar chart using plotly',
                showlegend=True,
                legend=go.layout.Legend(
                    x=0,
                    y=1.0
                )
            )
        )
    )
])
Callback
The @app.callback decorator is where the interactivity happens.
In the layout, we define an input which is going to be a dcc component like a text field or a dropdown and an output which is going to be an html component where the result is displayed.
app.layout = html.Div([
    dcc.Input(id='my-input', placeholder='type something'),
    html.Div(id='my-output')
])
Then we define a function that is going to process our input and return an output. We also use the @app.callback decorator where we define our inputs and outputs. Whenever an input property changes, the function will be called.
from dash.dependencies import Input, Output

@app.callback(
    Output(component_id='my-output', component_property='children'),
    [Input(component_id='my-input', component_property='value')]
)
def update_output(input_value):
    retun f"You've entered {input_value)"
What the above code does is that whenever you type something in the text field, the update_output() method will be called. The decorator set that the input is the value of the component with the my-input id. What the function returns will be sent to the output which is the component with the my-output id.
Let's see another example. We're going to have two dropdowns that will let us set the background and foreground colors of a <div>.
app.layout = html.Div([
    html.Div([
        dcc.Dropdown(
            id='background-color',
            options=[
                {'label':'blue', 'value':'#7570b3'},
                {'label':'orange', 'value':'#d95f02'},
                {'label':'green', 'value':'#1b9e77'}
            ],
            placeholder='background color',
            style={'width':'50%', 'display':'inline-block'}
        ),
    ]),
    html.Div([
        dcc.Dropdown(
            id='text-color',
            options=[
                {'label':'black', 'value':'#000000'},
                {'label':'white', 'value':'#ffffff'},
                {'label':'grey', 'value':'#b8b8b8'}
            ],
            value='black',
            placeholder='text color',
            style={'width':'50%', 'display':'inline-block'}
        )
    ]),
    html.Div('lorem ipsum', id='my-output')
])


@app.callback(
    [Output(component_id='my-output', component_property='style')],
    [Input(component_id='background-color', component_property='value'),
     Input(component_id='text-color', component_property='value')]
)
def update_output(backgroud_color, text_color):
    style = [{'background-color':backgroud_color,'color':text_color}]
    return style
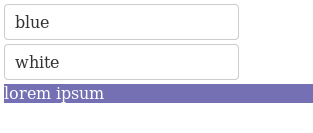
In the layout, we define two divisions that contain the dropdowns. A third division with some text will be formatted with the values set in the two dropdowns.
In this case, the callback decorator will get two inputs. Whenever a change is made in any of the inputs, the update_output() method is called.
The input Input(component_id='background-color', component_property='value') takes the value of the HTML component with the background-color id.
The input Input(component_id='text-color', component_property='value')] takes the value of the HTML component with the text-color id.
The values of the two inputs are then passed as arguments to the update_output() method: def update_output(backgroud_color, text_color). Using those two values, the method will set and return the style as it should be passed in the layout html component.
The output in the callback will tell Dash what to do with the value returned by the method. Here, Output(component_id='my-output', component_property='style') tells dash to send the value to the style attribute of the html component with the my-output id.
Live updates
To update the graph automatically at certain intervals, we add the dcc.Interval component to our layout.
We'll set three attributes:
- id: this is the id of the component used as a reference for the input of our callback.
- intervals: this is the time between each update in milliseconds.
- n_intervals: this is the number of the interval. It is incremented at each update.
As an example, we'll create a small app that draws the distribution of a variable with a normal distribution.
First, we add the interval component to our layout:
app.layout = html.Div([
    html.Div([
        html.H1('This is a live Graph'),
        dcc.Graph(id='live-graph'),
        dcc.Interval(
            id='interval-component',
            interval=100,
            n_intervals=0
        )
    ])
])
The interval becomes the input of our update method:
@app.callback(Output('live-graph', 'figure'),
              [Input('interval-component', 'n_intervals')])
Then in the update method, we generate a new value for x ...
x.append(np.random.normal(loc=0, scale=1))
... and create a new graph that we'll send to the output.
    figure = {
        'data': [go.Histogram(x=x)],
        'layout': go.Layout(
            title=f'Distribution of x ({n:,} values)',
            xaxis={'title':'X'},
            yaxis={'title':'count of X'}
        )
    }

    return figure
Let's put it all together
import dash
import dash_core_components as dcc
import dash_html_components as html
import plotly.graph_objs as go
from dash.dependencies import Input, Output
import numpy as np

app = dash.Dash(__name__)
x = []

app.layout = html.Div([
    html.Div([
        html.H1('This is a live Graph'),
        dcc.Graph(id='live-graph'),
        dcc.Interval(
            id='interval-component',
            interval=100,
            n_intervals=0
        )
    ])
])


@app.callback(Output('live-graph', 'figure'),
              [Input('interval-component', 'n_intervals')])
def update_histogram(n):
    x.append(np.random.normal(loc=0, scale=1))

    figure = {
        'data': [go.Histogram(x=x)],
        'layout': go.Layout(
            title=f'Distribution of X ({n:,} values)',
            xaxis={'title':'X'},
        )
    }

    return figure


if __name__ == "__main__":
    app.run_server(debug=True)
Here is our small application in action:
Integrate with flask
As I mentioned at the beginning of this post, Dash is built on Flask. There is a very good post written by Oleg Komarov that explains how to embed a Dash app into an existing Flask app. In his post, Oleg shows an example with a fully functioning complex flask application.
Conclusion
In this post, I went through the basics of creating interactive data visualizations using the Dash framework. It shows how we can easily create useful dashboards with only a couple of lines of code.
Resources
dash_html_components
dash_core_components
dash repository
How to embed a Dash app into an existing Flask app